PySpark — Structured Streaming Read from Kafka
Spark streaming acts as a real time data processing engine that allows you to process from various data sources including Apache Kafka. One of the benefits of using Spark streaming with Kafka is that it allows you to process large volume of data in real time and make near instantaneous decision based on the data.
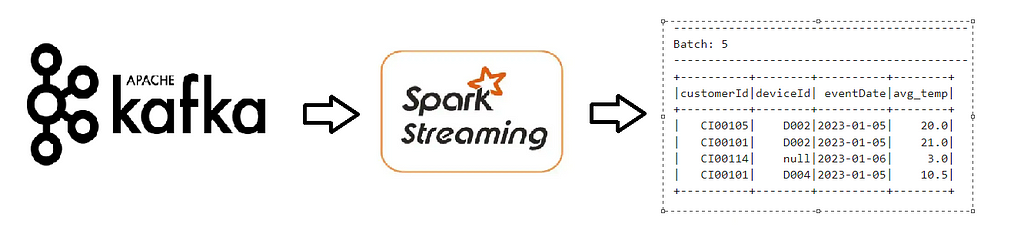
We are going to work on the same use-case, but this time we are going to read data from a Kafka cluster, get the average temperature per device per Customer for each day and write to console after computations.
Checkout the Usecase — https://urlit.me/blog/pyspark-structured-streaming-read-from-files/
To get started quickly with the setup for Kafka, Spark and Jupyter notebook, checkout Github for my custom docker image— https://github.com/subhamkharwal/docker-images/tree/master/pyspark-kafka-cluster
Once the setup is complete, lets quickly create the Kafka topic “devices” to post our data.


Kafka topic “devices” would be used by Source data to post data and Spark Streaming Consumer will use the same to continuously read data and process it using various transformations and actions.
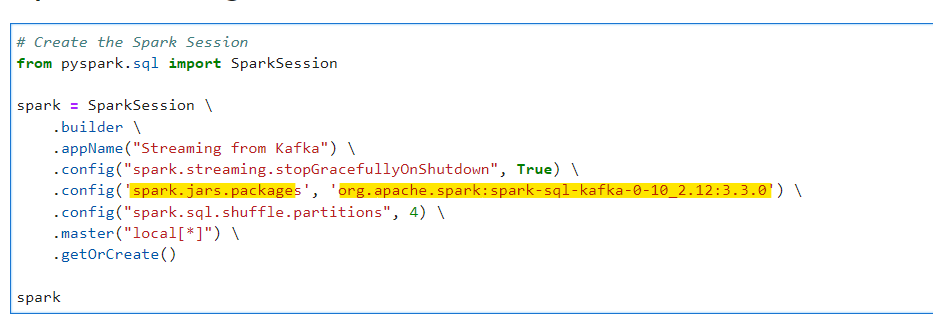
Lets create our Spark Session, with required packages to read from Kafka as Source.
# Create the Spark Session
from pyspark.sql import SparkSession

spark = SparkSession \
    .builder \
    .appName("Streaming from Kafka") \
    .config("spark.streaming.stopGracefullyOnShutdown", True) \
    .config('spark.jars.packages', 'org.apache.spark:spark-sql-kafka-0-10_2.12:3.3.0') \
    .config("spark.sql.shuffle.partitions", 4) \
    .master("local[*]") \
    .getOrCreate()

spark
Create the streaming dataframe to read the data from Kafka
# Create the streaming_df to read from kafka
streaming_df = spark.readStream\
    .format("kafka") \
    .option("kafka.bootstrap.servers", "kafka:29092") \
    .option("subscribe", "devices") \
    .option("startingOffsets", "earliest") \
    .load()
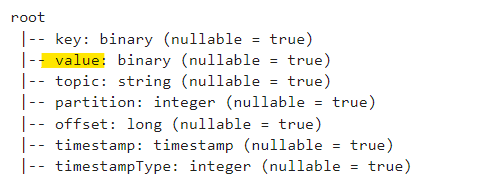
Data is posted in Kafka in the following dataframe format with some additional columns. The value column contains the actual data in Binary format.
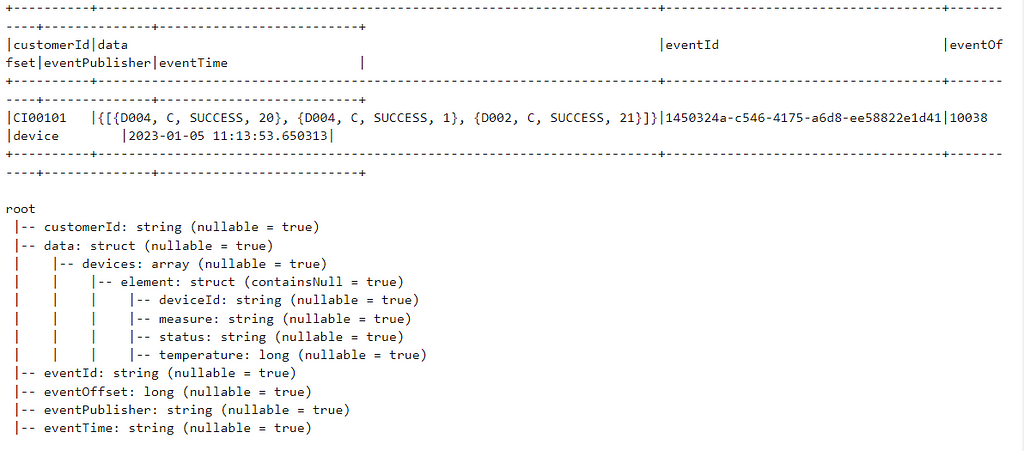
Schema to read the JSON Device data posted
# JSON Schema
from pyspark.sql.types import StringType, StructField, StructType, ArrayType, LongType
json_schema = StructType([StructField('customerId', StringType(), True), \
StructField('data', StructType([StructField('devices', ArrayType(StructType([ \
StructField('deviceId', StringType(), True), \
StructField('measure', StringType(), True), \
StructField('status', StringType(), True), \
StructField('temperature', LongType(), True)]), True), True)]), True), \
StructField('eventId', StringType(), True), \
StructField('eventOffset', LongType(), True), \
StructField('eventPublisher', StringType(), True), \
StructField('eventTime', StringType(), True)])
Lets read the data from value column, cast to string and expand the JSON
# Parse value from binay to string
json_df = streaming_df.selectExpr("cast(value as string) as value")

# Apply Schema to JSON value column and expand the value
from pyspark.sql.functions import from_json

json_expanded_df = json_df.withColumn("value", from_json(json_df["value"], json_schema)).select("value.*")
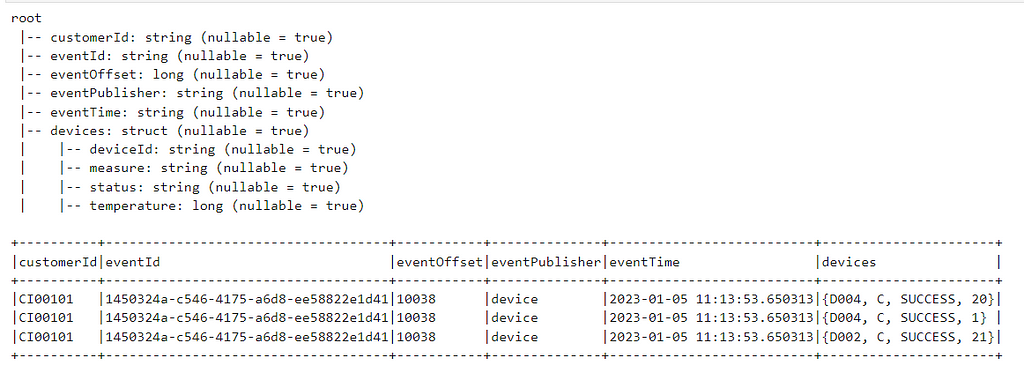
Lets explode the dataframe to get the devices array
# Lets explode the data as devices contains list/array of device reading
from pyspark.sql.functions import explode, col

exploded_df = json_expanded_df \
    .select("customerId", "eventId", "eventOffset", "eventPublisher", "eventTime", "data") \
    .withColumn("devices", explode("data.devices")) \
    .drop("data")
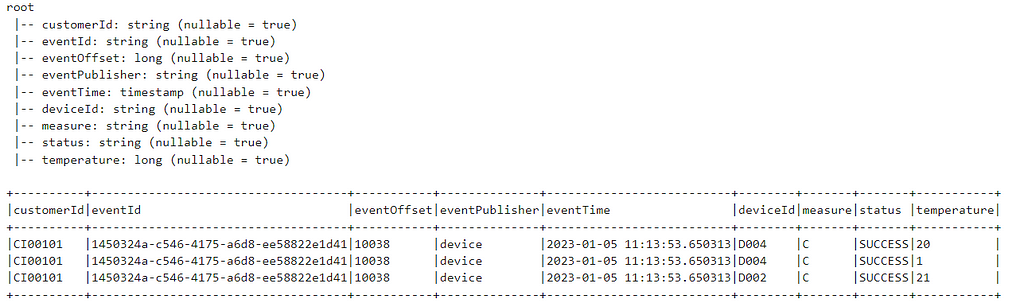
Flatten the dataframe
# Flatten the exploded df
flattened_df = exploded_df \
    .selectExpr("customerId", "eventId", "eventOffset", "eventPublisher", "cast(eventTime as timestamp) as eventTime",
                "devices.deviceId as deviceId", "devices.measure as measure",
                "devices.status as status", "devices.temperature as temperature")
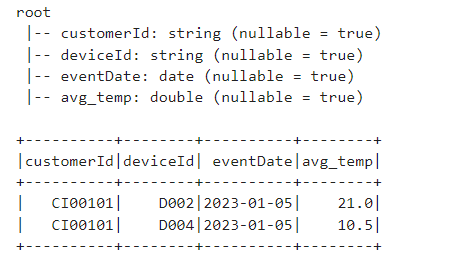
Now, filter the data on SUCCESS events and get the AVG temperature for each device as per Customer per day
# Aggregate the dataframes to find the average temparature
# per Customer per device throughout the day for SUCCESS events
from pyspark.sql.functions import to_date, avg

agg_df = flattened_df.where("STATUS = 'SUCCESS'") \
    .withColumn("eventDate", to_date("eventTime", "yyyy-MM-dd")) \
    .groupBy("customerId","deviceId","eventDate") \
    .agg(avg("temperature").alias("avg_temp"))
Lets, write the data to console in outputMode as complete
# Write the output to console sink to check the output
writing_df = agg_df.writeStream \
    .format("console") \
    .option("checkpointLocation","checkpoint_dir") \
    .outputMode("complete") \
    .start()

# Start the streaming application to run until the following happens
# 1. Exception in the running program
# 2. Manual Interruption
writing_df.awaitTermination()
Before starting, post one device event from the samples provided to validate.
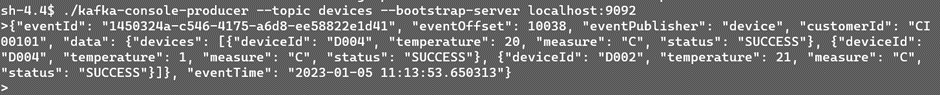
See the output in real-time action
We can now automate this, run the script “post_to_kafka.py” to generate and post random device events to Kafka. Now, see the aggregation in real-time
With the above example, you can feel the real-time scenario for devices data flowing through Kafka. We can now write the data to any down-stream system in any format as per requirement (just replace console with required system).
Checkout the iPython Notebook on Github — https://github.com/subhamkharwal/ease-with-apache-spark/blob/master/32_spark_streaming_read_from_files.ipynb
Checkout the docker images to quickly start — https://github.com/subhamkharwal/docker-images
Checkout my Personal blog — https://urlit.me/blog/
Checkout the PySpark Medium Series — https://medium.com/@subhamkharwal/learnbigdata101-spark-series-940160ff4d30
Top Five
Following are the top five articles as per views. Don't forget check them out:
Buy me a Coffee
If you like my content and wish to buy me a COFFEE. Click the link below or Scan the QR.
Buy Subham a Coffee
*All Payments are secured through Stripe.

About the Author
Subham is working as Senior Data Engineer at a Data Analytics and Artificial Intelligence multinational organization.
Checkout portfolio: Subham Khandelwal